In this class they don’t explain any new concepts. We continue to develop the Gantt chart from the previous session, while at the same time we realize the economic costs that our project will have.
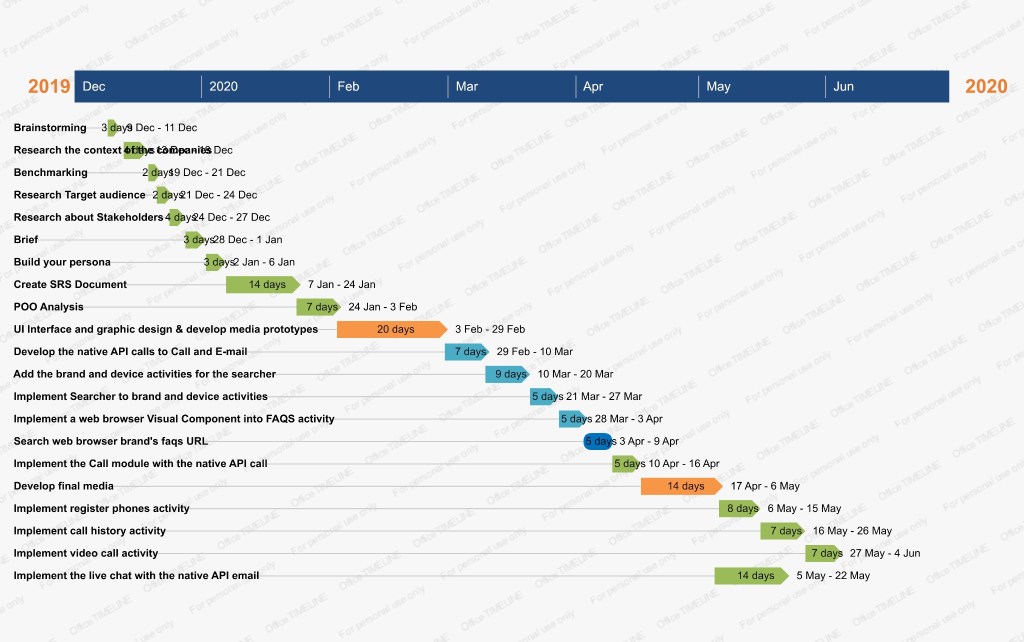
GANTT
Finally, we can see our diagram completed:
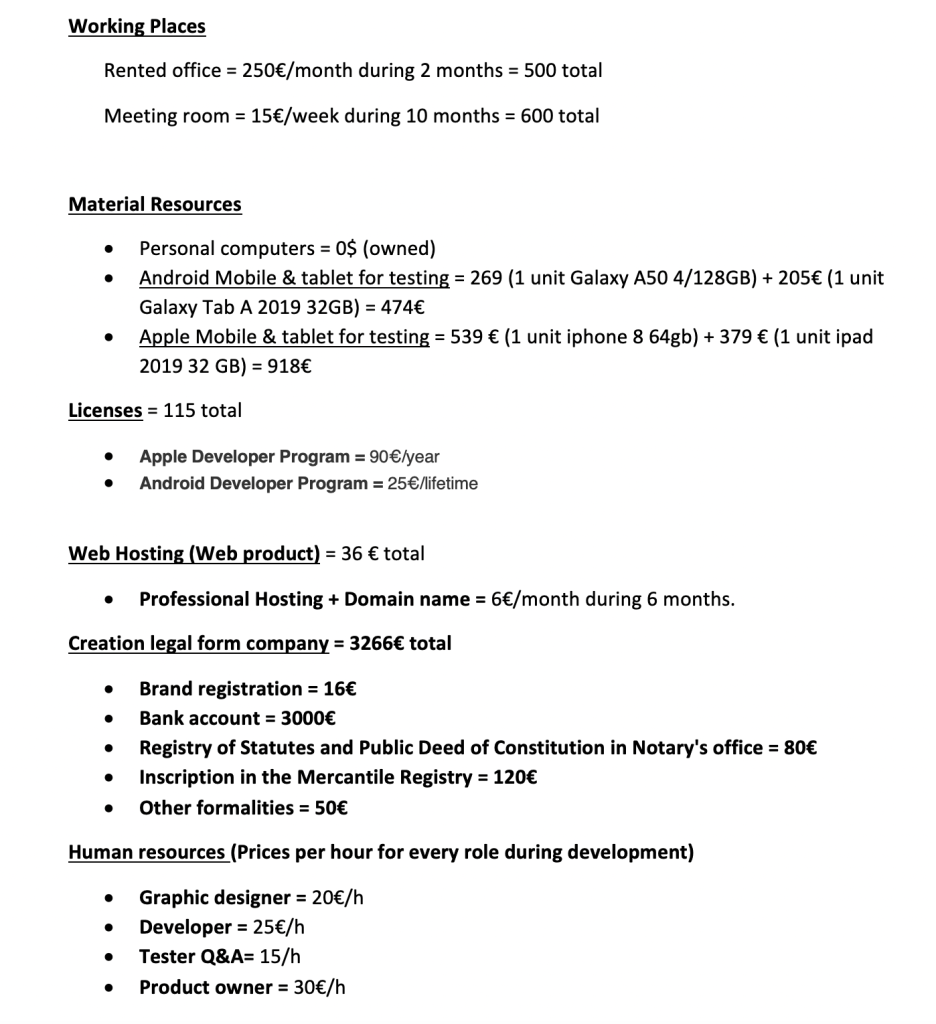
COST SCHEME
Next, we can see the detailed diagram of costs according to different economic items:
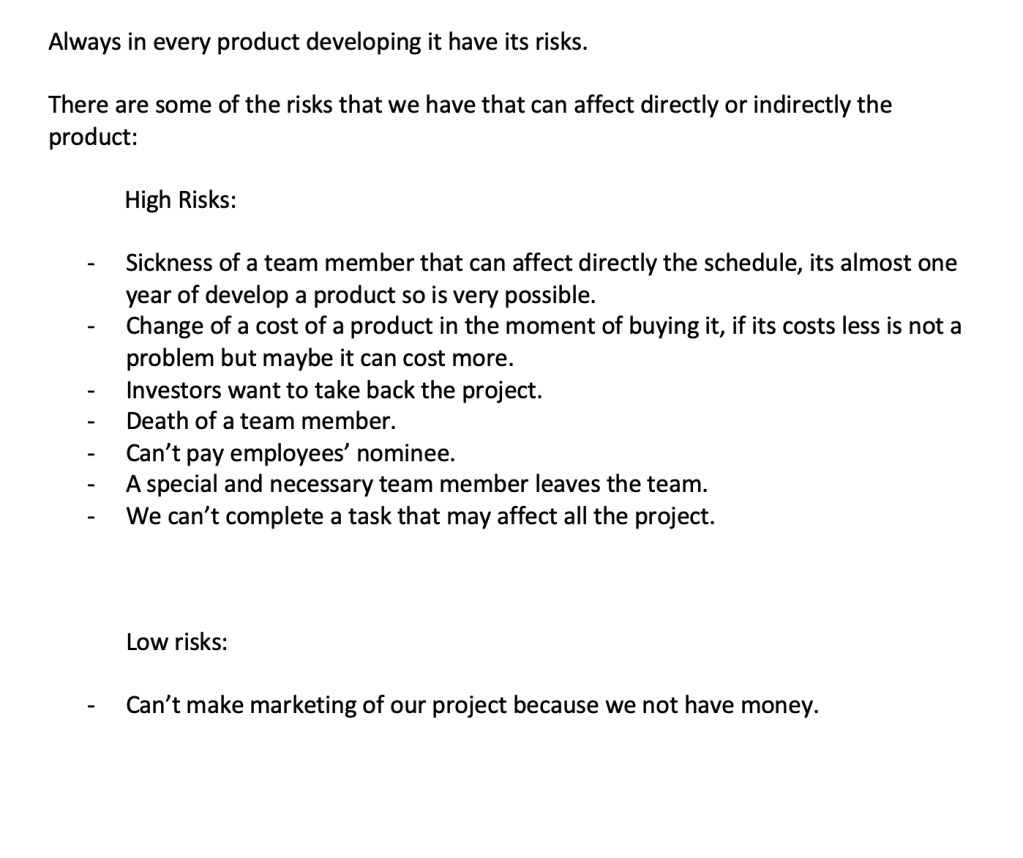
Finally, we evaluate the risks that our project may have and will have whether they are high or low throughout the development time:
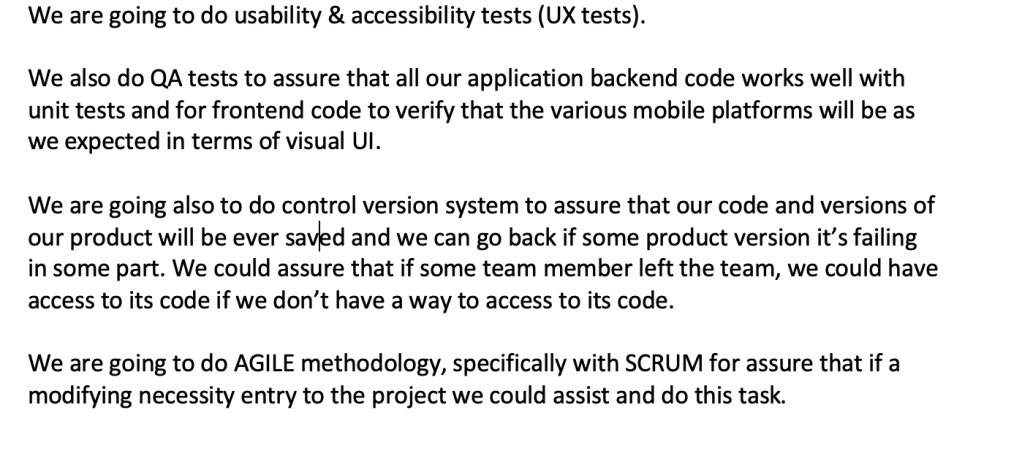
As well as that it have a very good quality to be able to satisfy to the maximum the user and that this one has a very good UX of our product. In the following screenshot, it is explained in more detail: